This blog covers the steps to analyze SyriaTel customer data. In this project, I tried to find the features that are significantly related to the churn of customers for SyriaTel service. To this end, I have both analyzed individual features with respect of the churn and built binary classification models for prediction of customer’s churn label.
Data analysis
The data is SyriaTel Customer Churn with the file name as: bigml_59c28831336c6604c800002a.csv
First, I loaded the data to checked the potential features, and found:
- There are 20 features and one target, i.e., churn, and no missing data from all columns
- A total of 3333 entries
- Data types of several columns need to be changed
Second, I prepared the data:
- the column names: replace ‘ ‘ with ‘’
- the column ‘phone number’: drop it since it generally does not affect the customer churn
- the column ‘internationalplan’ and ‘voicemailplan’: replace ‘yes’ and ‘no’ with 1 and 0
- the target column ‘churn’: convert boolean into int, and I also found the target is imbalanced: 0-2850 entries,1-483 entries
Third, I examined the features one-by-one:
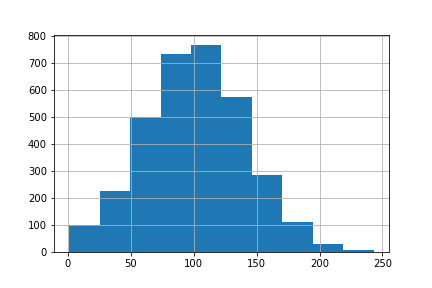
1) ‘account_length’: a normal distribution and in the unit of day
2) ‘area_code’: the churn rates are similar across three unique area codes, therefore, this feature can be excluded from classification
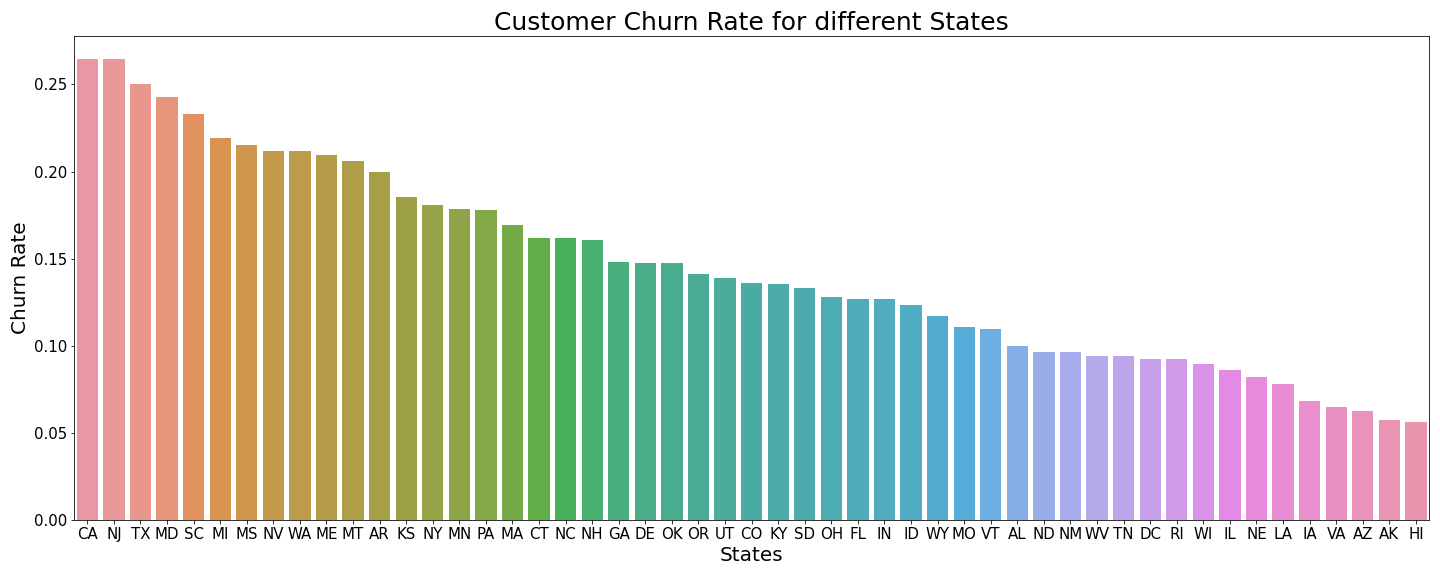
3) ‘state’: different states have different churn rate, CA and NJ are the two highest churn rate states > 25%, while AK and HI are the two lowest churn rate states < 6%
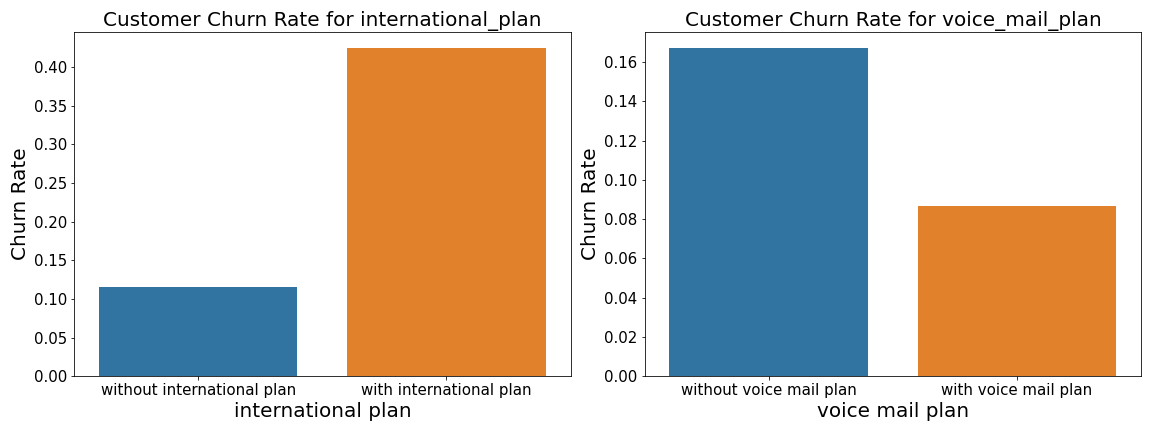
4) ‘international_plan’ and ‘voice_mail_plan’: the customers with international plan but without voice mail plan have higher churn rate
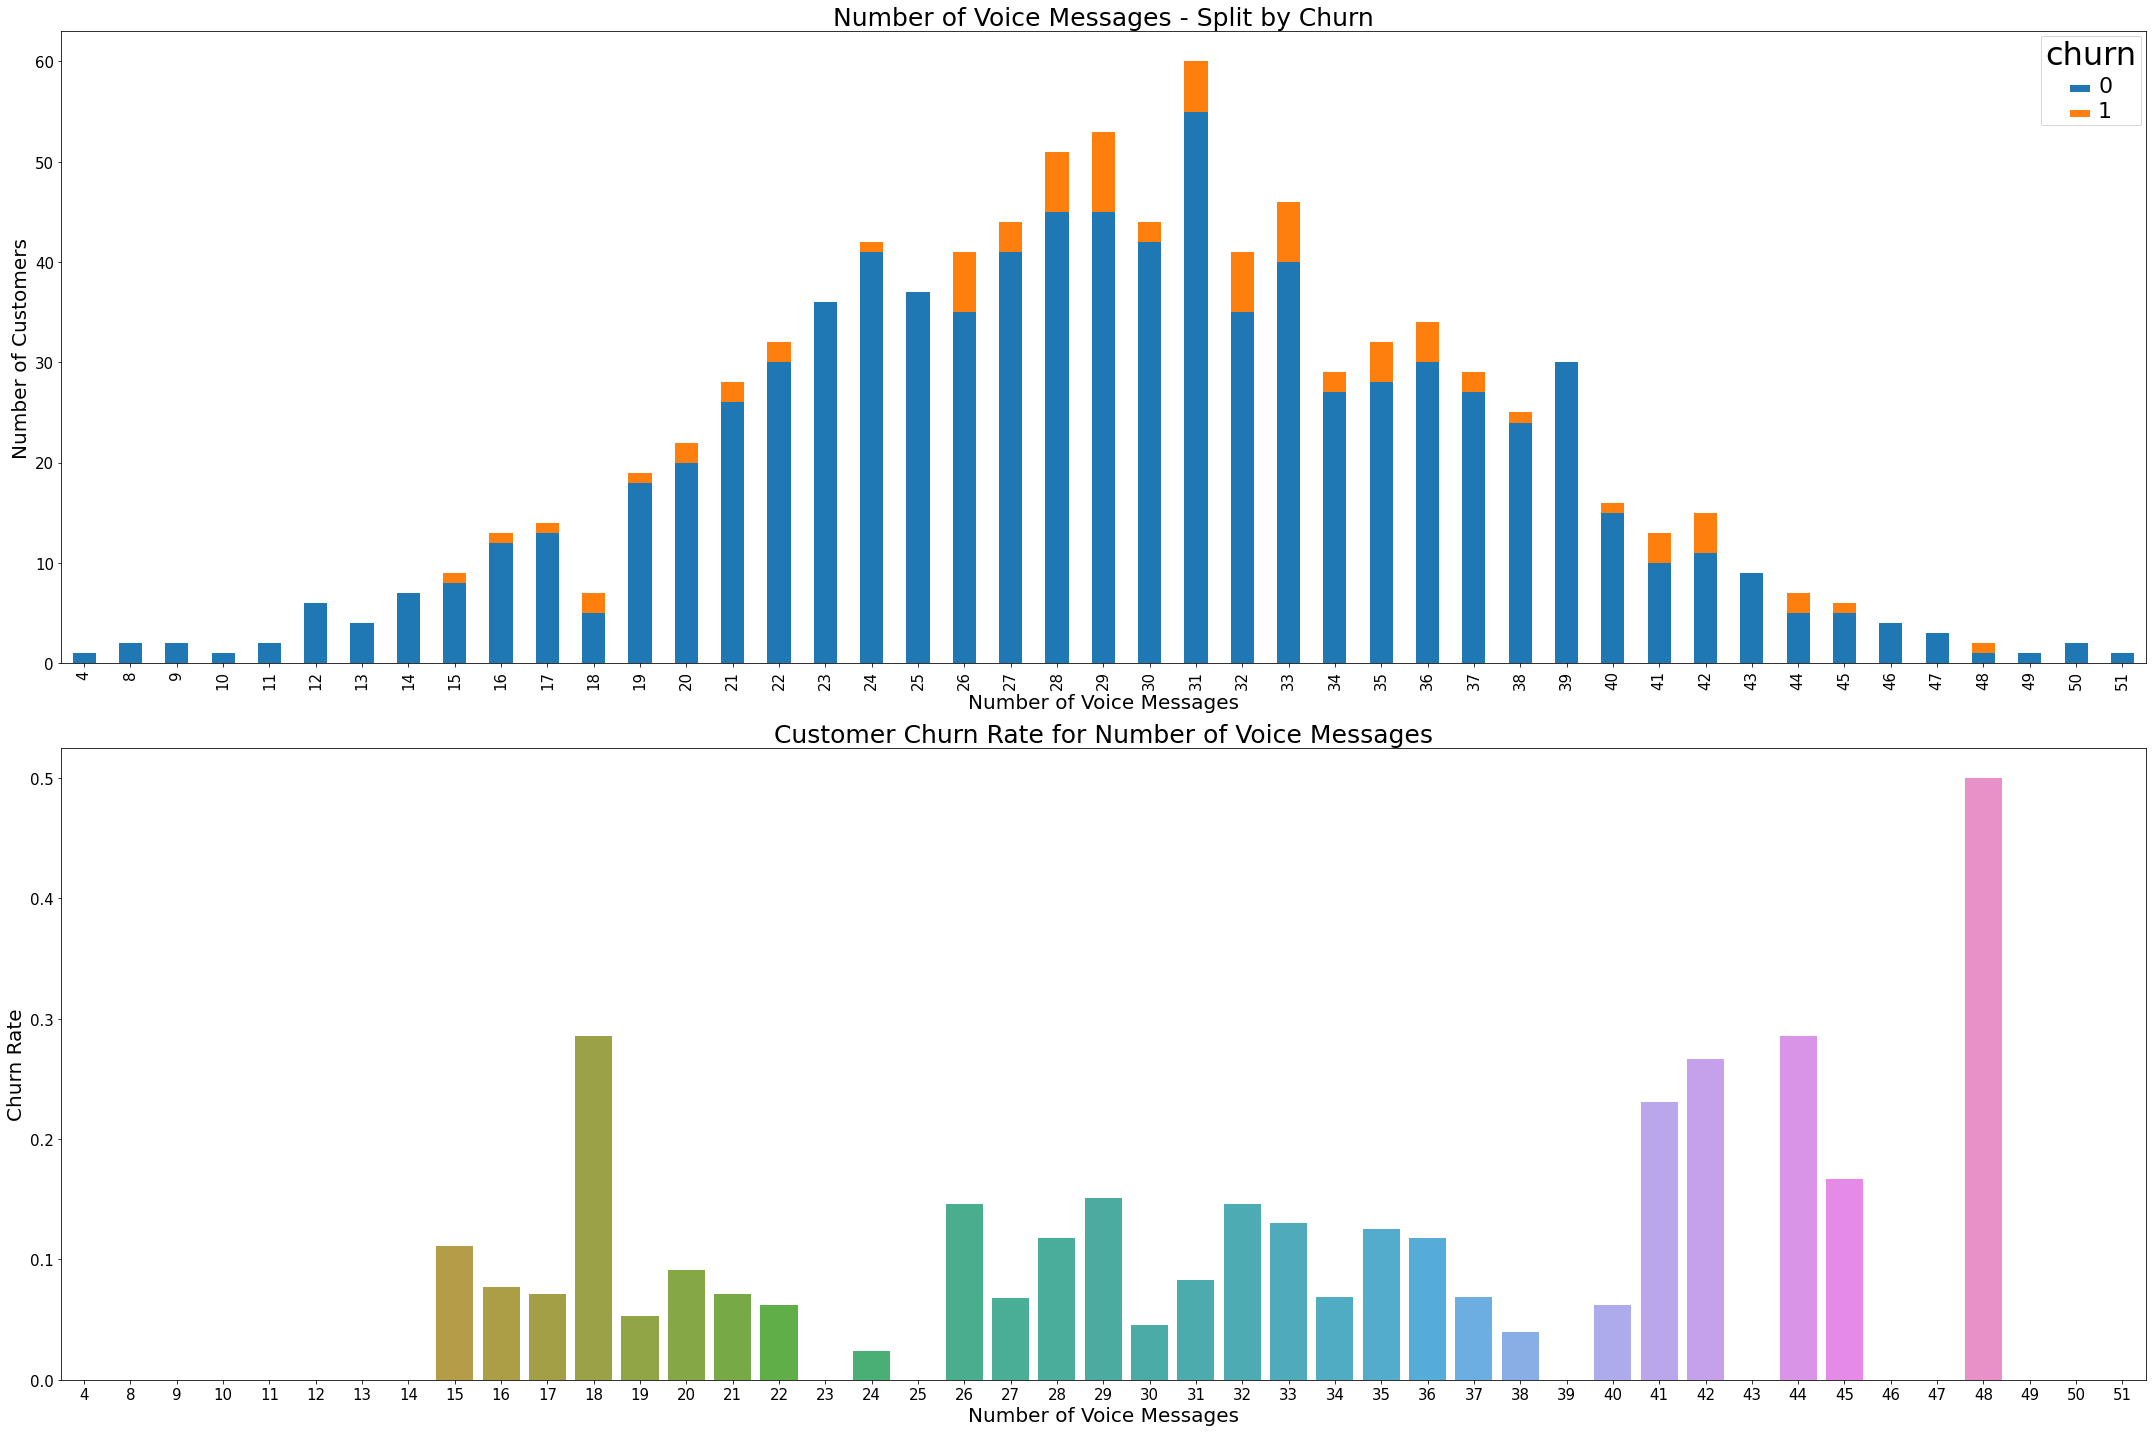
5) ‘number_vmail_messages’: This feature seems not well sampled, since there are too many customers in the survey has 0 number of voice messages. Meanwhile, this feature also have some relationship with the churn rate
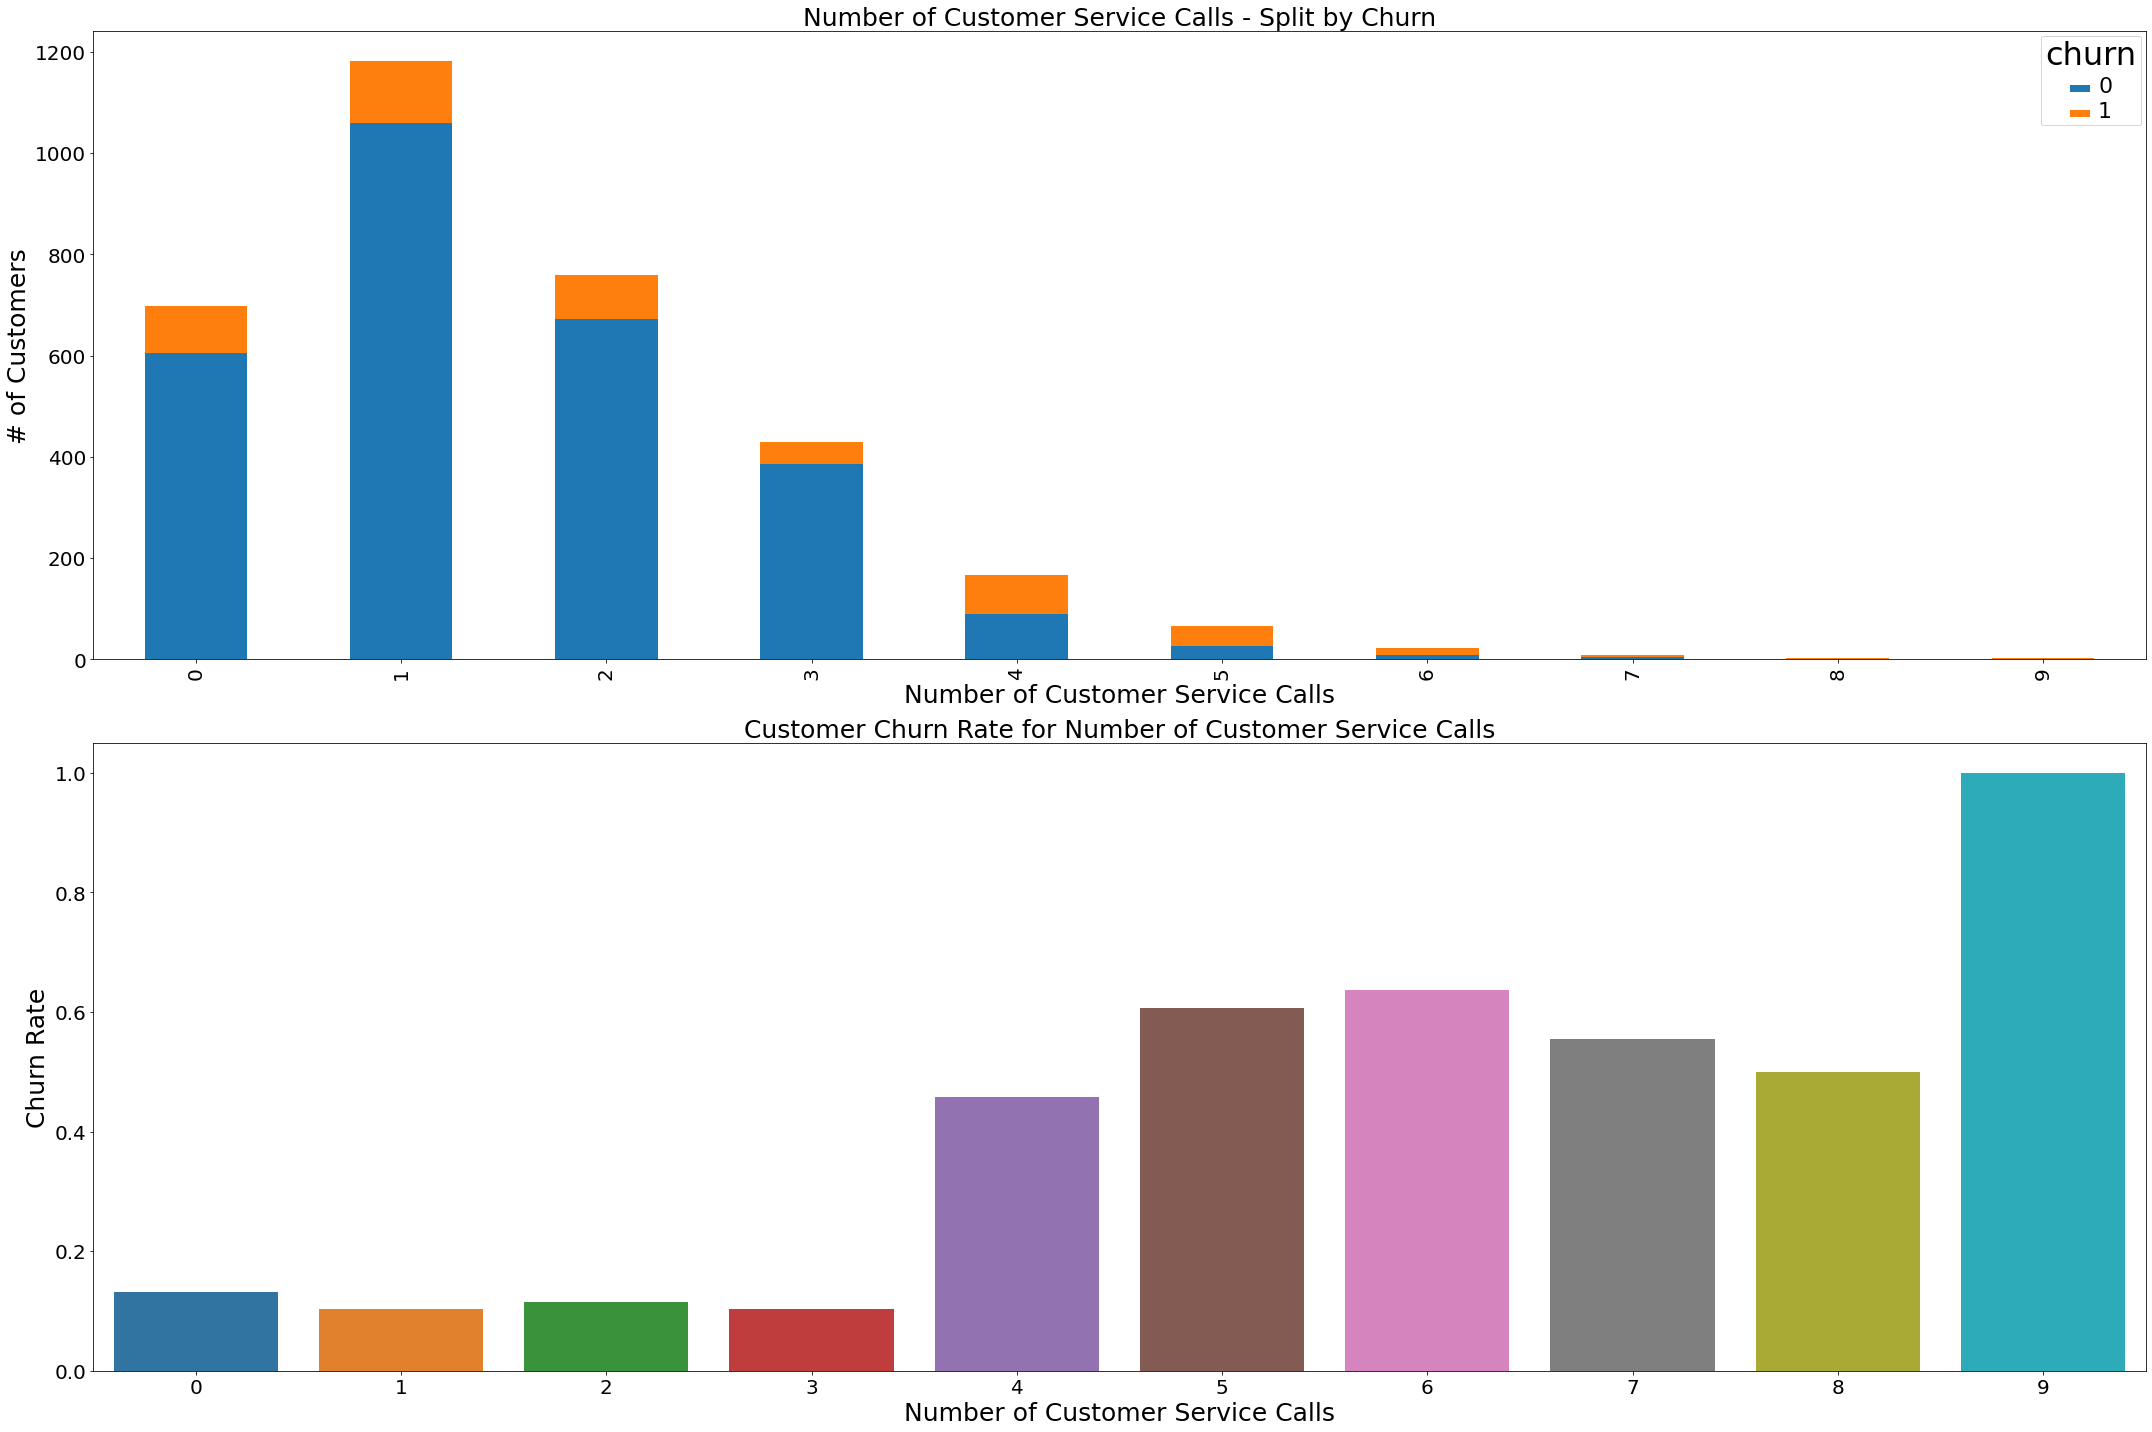
6) ‘customer_service_calls’: the customers with number of service calls as 4,5,6 have larger churn rate, while less than 4 are likely to drop
7) The remaining features related to calls and charges within four different categories: day, eve, night, intl, might have high correlation. I found the minutes and charge in each category has close to 1 correlation.so I will drop the columns of charge in the following classification models
Modeling
Prepare train and test data
After examining all features, I prepare the train and test data:
- The target is the churn column
- The features are all columns after excluding churn’,’area_code’,’total_day_charge’,’total_eve_charge’,’total_night_charge’,’total_intl_charge’
- For ‘state’, I will do oneHotEncoder for both X_train and X_test
- Split data into train and test part
- Since churn== 1 is signficantly smaller than churn==0,i.e., 358 vs. 2141, I will use SMOTE oversampling
Build a baseline model using decision tree
The performance of the baseline model is: - confusion matrix: [[1997 144] [ 78 280]] - accuracy_score: 0.911 - f1_score: 0.716 - recall_score: 0.782 not bad
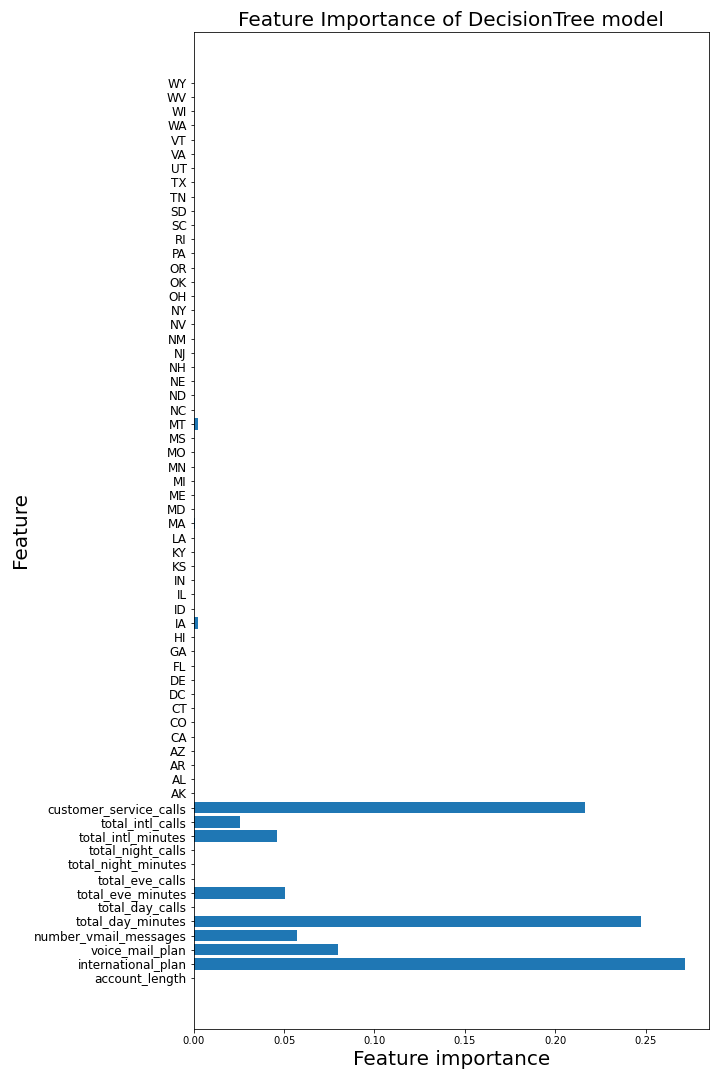
The importance of each feature is shown in the following figure: three features are the most important ones
- customer_service_calls
- total_day_minutes
- international_plan
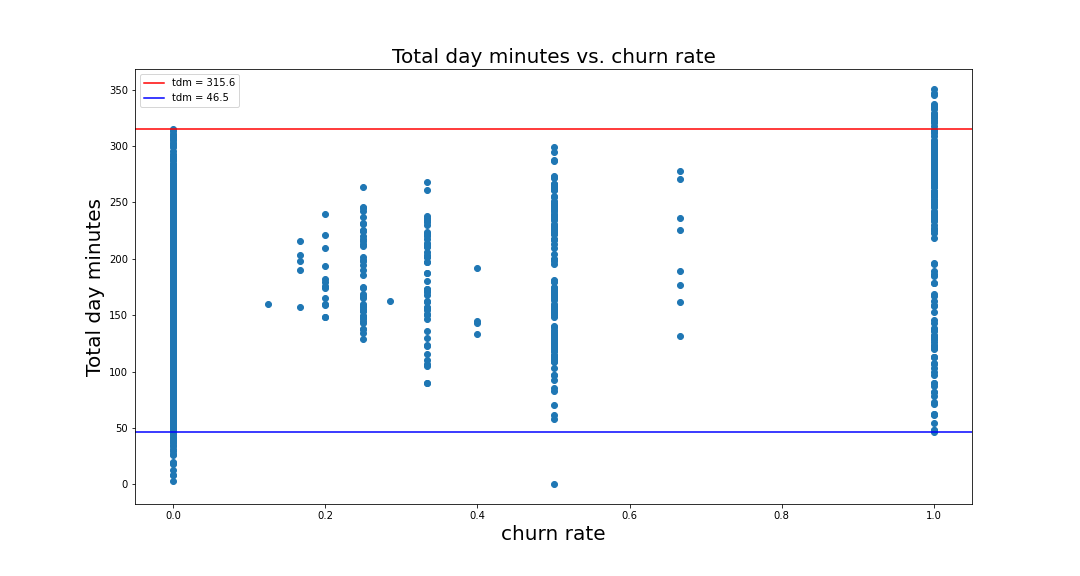
take a look total_day_minutes: total day minutes > 315.6, churn rate is 100%, and total day minutes < 46.5, churn rate is mostly 0
Classification Model Comparisons using different classifiers
- DecisonTreeClassifier
- KNeighborsClassifier
- RandomForestClassifier
- AdaBoostClassifier
- GradientBoostingClassifier
the performance is shown as:
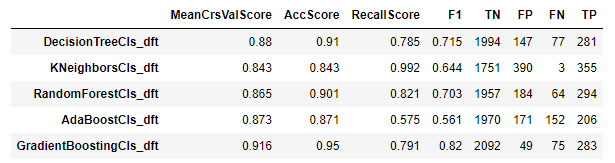
The GradientBoostingClassifier achieves the best results, So I will use this model in the following analysis
Based on its intial parameters, I used gridsearch to find the optimal parameters, and obtained best parameters are: {‘learning_rate’: 0.1, ‘loss’: ‘deviance’, ‘max_depth’: 5, ‘min_samples_leaf’: 1, ‘min_samples_split’: 2}
Final model with GradientBoostingClassifier
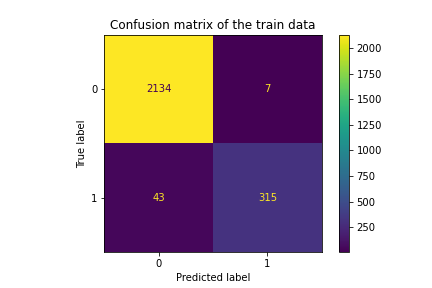
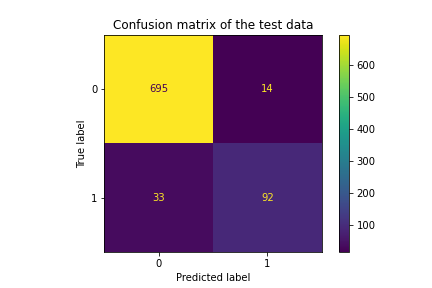
The performance of final model on training and test data are:
Final model for train data: accuracy_score: 0.98 recall_score: 0.88 f1_score: 0.926
Final model for test data: accuracy_score: 0.944 recall_score: 0.736 f1_score: 0.797
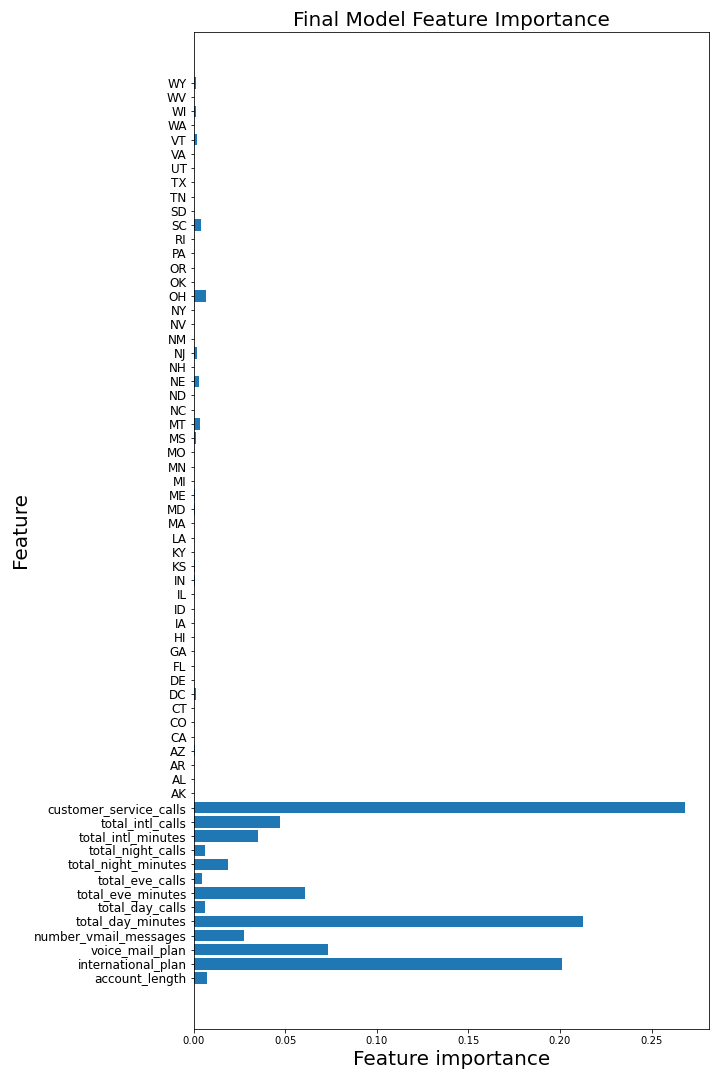
and the feature importance for the final model is
Summary
From the classification models, I found that three features affected the customer churn rate most significantly:
- customer_service_calls: The customers with large number of service calls as 4,5,6 seems have the larger churn rate
- international_plan: The customers with international plan have the higher churn rate
- total_day_minutes: The customers with the total day minutes > 315.6, churn rate is 100%, and total day minutes < 46.5, churn rate is mostly 0, therefore, the company need to deal with the customers with the total day minutes between 46.5 to 316 mins
Regarding states: AZ, AK and HI have the lowest churn rate states, therefore, need to pay more attention on the customers from these states